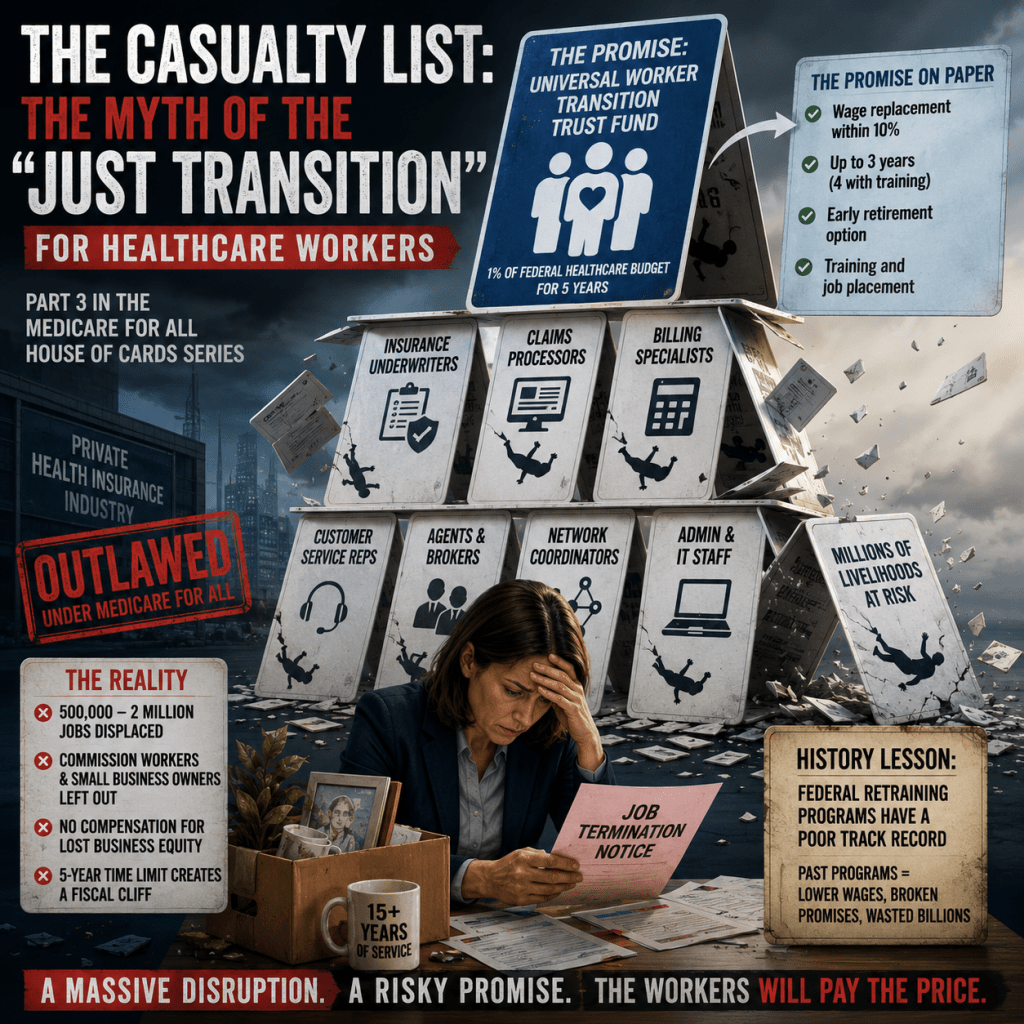
The Casualty List: The Myth of the “Just Transition” for Healthcare Workers

Part 3 in the Medicare for All House of Cards Series
Medicare for All sounds like a great solution to the problems in the US healthcare system, but when people talk about it they often do so without any recognition of the human cost of making this kind of structural change.  Implementing this plan would completely eliminate the health insurance industry and severely decrease opportunities for hundreds of thousands of Americans in businesses tied to that industry.  This cost must be added to the assessment of the overall plan.

The policy makers putting forth the Medicare for All plan are fully aware of the potential impact on the workforce.  When policymakers discuss these types of massive structural shifts, they frequently lean on a comforting euphemism: the “just transition.” In the Medicare for All Act of 2025 (S.1506/H.R.3069)¹, this concept takes the form of a federally funded worker transition program. Recognizing that a single-payer system would eliminate the private commercial health insurance market, the bill’s supporters promise to protect the livelihood of every displaced worker.

It is a noble promise, but it runs up against a significant logistical reality. A 2018 economic analysis by researchers at the Political Economy Research Institute (PERI) at UMass Amherst, a study conducted in support of Medicare for All, not against it, estimated that eliminating the private insurance and medical billing bureaucracy would displace approximately 1.8 million workers, including nearly 300,000 aged 60 or older.² A critical look at the funding mechanism and America’s historical record with federal job-retraining reveals real reasons for caution.

The Legislative Blueprint

The bill text provides for wage replacement, continued retirement and pension benefits, job training and placement, preferential hiring for displaced workers into new government roles, and education benefits.¹ Beyond that general framework, the precise formulas, how long wage support lasts, how it’s calculated for workers with variable income, and how tightly the transition period is bounded, are not fully specified in the bill text as introduced, leaving important implementation details to be worked out administratively.

This creates real ambiguity for certain groups. Independent insurance agents and brokers whose income relies on fluctuating commissions and policy renewals present a genuine complication: calculating a fair wage-replacement baseline for a self-employed contractor is more complex than for a salaried employee, and the bill does not appear to address the loss of a broker’s “book of business,” an active client portfolio that functions as a sellable asset, as a compensable loss.

The Structural Vulnerability of the Funding Model

Rep. Jayapal has publicly confirmed the funding mechanism: 1% of the total cost of the bill, set aside annually for five years, to support displaced workers.³ If, as estimates suggest, the single-payer budget runs $3–3.4 trillion annually, that translates to roughly $30–34 billion a year for worker transition.  This money comes out of the same overall health care budget, rather than from a separate, dedicated fund. That creates a structural tension: every dollar spent on severance, retraining, and placement services for displaced workers is a dollar not spent on direct patient care. And because the fund is bounded at five years, the program faces a hard cutoff if structural unemployment in this sector proves more persistent than anticipated.

The Historical Record: Why Federal Retraining Often Falls Short

Proponents argue that unprecedented funding levels will succeed where past programs failed. But America’s track record with federal job retraining gives real reason for skepticism. The clearest example is Trade Adjustment Assistance (TAA), the flagship federal program for retraining manufacturing workers displaced by trade. A rigorous 2012 evaluation conducted by Mathematica Policy Research for the U.S. Department of Labor, using a matched comparison group of similar displaced workers who did not participate in TAA, found that TAA participants earned about $3,300 less annually than their non-participating counterparts in the final year of the multi-year follow-up period, and calculated the program’s overall net benefit to society as negative.⁴ The researchers noted this may partly reflect the time it takes older, long-tenured workers to successfully retrain, a dynamic that could plausibly recur among displaced insurance-industry workers, many of whom are older, specialized administrative staff. Coal-to-clean-energy retraining programs offer a second cautionary parallel: these initiatives have consistently struggled with geographic and skill mismatches between displaced workers and available new jobs.

The Bottom Line

The Worker Transition program relies on succeeding where comparable federal efforts have historically struggled. Generous funding can pay for training and temporary income support, but it cannot guarantee that hundreds of thousands of specialized insurance and billing workers will find comparable new roles on the timeline the bill anticipates. The gap between the money committed and the outcomes historically achieved by similar programs is worth taking seriously before assuming this transition will go smoothly.

Let’s be clear, the problem with the Sanders plan isn’t a lack of funding for workers; it is a fundamental misunderstanding of labor logistics. Throwing $150 billion at a problem can buy tuition and extend unemployment checks, but it cannot instantly manufacture hundreds of thousands of vacant, high-paying, white-collar jobs that perfectly match the skills of displaced corporate insurance workers. Shifting an entire workforce by government decree is an incredibly slow, friction-heavy process. By limiting the trust fund to a strict five-year window, the plan assumes an economic agility that the federal government has never historically been able to deliver.


Sources

  1. Medicare for All Act, H.R. 3069, 119th Cong. (2025); S. 1506, 119th Cong. (2025). Full text: congress.gov/bill/119th-congress/house-bill/3069/text
  2. Pollin, R., Heintz, J., Arno, P., Wicks-Lim, J., & Ash, M. (2018). Economic Analysis of Medicare for All. Political Economy Research Institute, University of Massachusetts Amherst, Appendix 6: “Estimating Displaced Workers.” peri.umass.edu/publication/economic-analysis-of-medicare-for-all
  3. Jayapal, P., quoted in “‘Medicare-for-all’ sponsor says plan would gut 1 million private insurance jobs,” Fox News (2019). foxnews.com/politics/medicare-for-all-would-gut-a-million-private-insurance-jobs
  4. Schochet, P.Z., D’Amico, R., Berk, J., Dolfin, S., & Wozny, N. (2012). Estimated Impacts for Participants in the Trade Adjustment Assistance (TAA) Program Under the 2002 Amendments. Mathematica Policy Research, prepared for the U.S. Department of Labor. dol.gov/sites/dolgov/files/ETA/publications/ETAOP_2013_08.pdf

For Further Reading: Sources for the “House of Cards” Medicare for All Series

This document consolidates every source used to verify claims across all three essays in the Medicare for All series, plus additional context readers may find useful. Organized by topic.

The Bill Itself

Federal Cost Estimates

  • Blahous, C. (2018). The Costs of a National Single-Payer Healthcare System. Mercatus Center at George Mason University. Estimated ~$32.6 trillion in added federal costs over 10 years (2022–31), using assumptions favorable to the plan’s proponents as a lower-bound estimate. mercatus.org — “How the Urban Institute’s Estimates of Medicare for All Costs Stack Up”
  • Urban Institute & Commonwealth Fund (2019). From Incremental to Comprehensive Health Insurance Reform. Estimated ~$32–34 trillion in added federal costs over 10 years (2020–29). urban.org/research/publication/estimating-cost-single-payer-plan
  • Congressional Budget Office (December 2020). How CBO Analyzes the Costs of Proposals for Single-Payer Health Care Systems. Modeled four illustrative single-payer designs; savings ranged from $42 billion to $743 billion in 2030 depending on assumptions, with the closest match to current bills (“Option 3”) yielding roughly $650 billion in savings — the source of the frequently cited “$650 billion” figure. Note: this is an analysis of illustrative design options, not a formal score of H.R. 3069/S. 1506. cbo.gov/publication/56898
  • Pollin, R., Heintz, J., Arno, P., Wicks-Lim, J., & Ash, M. (2018). Economic Analysis of Medicare for All. Political Economy Research Institute (PERI), UMass Amherst. A study conducted in support of the 2017 Sanders bill; estimated net national health spending would fall by about 9.6% under the plan. peri.umass.edu/publication/economic-analysis-of-medicare-for-all
  • Yale School of Public Health study (Galvani et al., 2020), published in The Lancet — estimated Medicare for All could save approximately 68,000 lives and reduce health spending by roughly 13% (~$450 billion) annually. Referenced in: Public Citizen, “Fact Check: Medicare for All Would Save the U.S. Trillions”

Worker Displacement and Transition

  • PERI (2018), Appendix 6: “Estimating Displaced Workers” — estimated approximately 1.8 million workers displaced from private health insurance and related administrative roles, including nearly 300,000 aged 60 or older. Same source as above.
  • Jayapal, P. — public statement confirming the “1% of total bill cost, set aside annually for five years” worker transition funding mechanism, and a separate public estimate of “about a million” displaced workers. Reported in: Fox News, “‘Medicare-for-all’ sponsor says plan would gut 1 million private insurance jobs” (2019)
  • Schochet, P.Z., D’Amico, R., Berk, J., Dolfin, S., & Wozny, N. (2012). Estimated Impacts for Participants in the Trade Adjustment Assistance (TAA) Program Under the 2002 Amendments. Mathematica Policy Research, prepared for the U.S. Department of Labor. Found TAA participants earned about $3,300 less annually than a matched comparison group in the final follow-up year; overall net benefit to society calculated as negative. dol.gov/sites/dolgov/files/ETA/publications/ETAOP_2013_08.pdf
  • U.S. Department of Labor, “National Evaluation of the Trade Adjustment Assistance Program” — background on TAA program design and participation rates. dol.gov/agencies/eta/research/publications/national-evaluation-trade-adjustment-assistance-program

International Comparisons

Independent Fact-Checking and Context

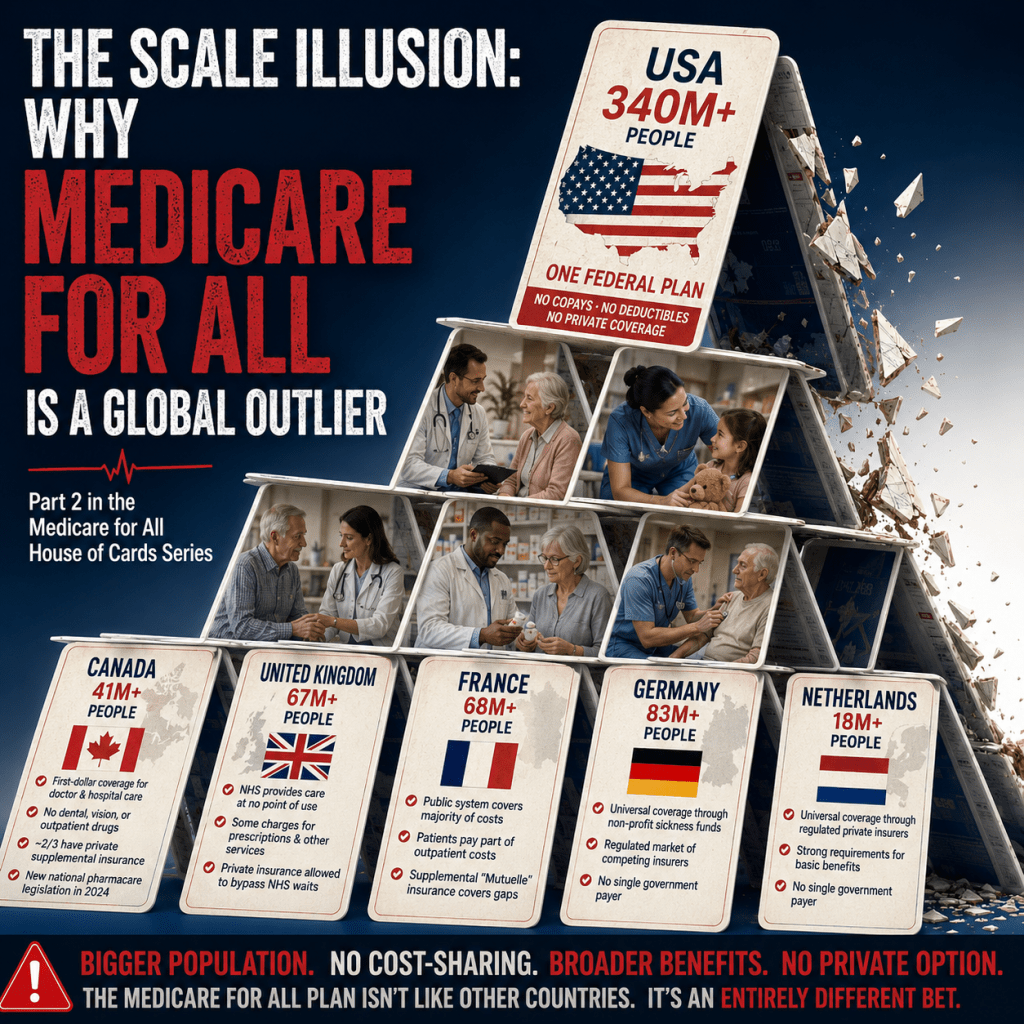
The Scale Illusion: “Medicare for All” Is a Global Outlier

Part 2 in the Medicare for All House of Cards Series

“Every other developed country has universal healthcare.”  It’s been said so many times that it’s almost cliché.  Here’s the problem, universal healthcare doesn’t mean the same thing to everyone who says it and it comes in many forms even for the nations that have it.  For our purposes, let’s call it “single-payer healthcare systems” so that we can build a clear picture of what we are trying to build.  And let’s also make sure when we compare what happens in the US to what happens in other places, we make sure our comparisons take into account the scope and scale of what we are proposing.

Whenever single-payer healthcare is defended in American political discourse, proponents invariably point outside our borders, to Canada, the United Kingdom, or Western Europe, as proof that universal, government-run systems are efficient, affordable, and popular. This comparison is incomplete and perhaps even inappropriate.

The single-payer system envisioned in the Medicare for All Act of 2025¹ is not a standard adoption of European-style socialized medicine. Despite arguments to the contrary, the US is not the same as those other nations often used for comparison. Examining the sheer scale and the specific design choices embedded in the American plan shows it departs from every existing universal system in the developed world in several important respects.

First: The US Context Demands an Unprecedented Leap in Scale

The most immediate difference between the proposed system and existing international models is scale. The United Kingdom’s National Health Service covers a population of roughly 67–68 million.² Canada’s Medicare system covers about 41 million people, and unlike the centralized U.S. proposal it is not run as a single national program; each of Canada’s provinces and territories administers its own plan under the framework of the federal Canada Health Act.³

The Medicare for All Act would consolidate a population of roughly 340 million people under a single federal program managed out of Washington.¹ A federal agency processing claims and setting national payment rates for over $3 trillion in annual spending across a population eight times the size of any comparable existing system represents a genuinely novel scale of administrative centralization.  This is not necessarily unworkable, but it is untested at this scale.

Second: The Abolition of Cost-Sharing and Expanded Areas of Coverage Call for an Unprecedented Expansion of Scope

The current Medicare for All proposal calls for an elimination of nearly all point-of-service costs including copays, deductibles, and coinsurance, with only a $200 annual cap for prescription drugs.¹  This is unusual by international standards. According to the Commonwealth Fund’s International Health Care System Profiles, most peer nations retain some form of cost-sharing:

  • Canada provides first-dollar coverage for physician and hospital services with no cost-sharing, but this doesn’t extend to dental care, vision care, or outpatient prescription drugs, which are excluded from the core public system in most provinces. About two-thirds of Canadians carry supplementary private insurance, commonly through employer plans, to cover these gaps. These supplemental plans would be outlawed under the Sanders plan in the US.  Canada has historically been the only developed country with universal health coverage that doesn’t include a national pharmacare program, though the government introduced initial pharmacare legislation in 2024.³ ⁴
  • France’s system reimburses a substantial share of routine outpatient costs through the public insurer, with patients typically responsible for the remainder, which most French residents cover through supplemental “Mutuelle” insurance, similar in spirit to Canada’s supplemental market.⁵

By eliminating essentially all of these gaps and cost-sharing mechanisms at once, the Sanders bill removes a tool that most peer systems still use, in some form, to manage utilization and cost.

Universal systems outside the US typically draw firmer lines around what the public system covers. As noted above, Canada’s core public program has historically excluded dental, vision, and outpatient drug coverage, pushing citizens toward private supplemental insurance or provincial safety-net programs for those services.³ ⁴ The Medicare for All Act, by contrast, folds comprehensive adult dental, vision, hearing, and long-term care directly into the core federal program at no cost to the patient¹  This is a substantially broader guaranteed benefit package than what any of these peer nations currently provides through their public system alone.

Perhaps the most restrictive element of the bill is its prohibition on private insurers selling coverage that duplicates the federal program’s benefits.¹ This is a genuine outlier internationally:

  • Germany, France, and the Netherlands achieve universal coverage not through a single government payer but through tightly regulated markets of competing nonprofit or private “sickness funds” and insurers.⁵
  • The UK’s NHS, despite being a pure single-payer system, does not prohibit private insurance. UK residents can purchase private medical insurance that runs in parallel to the NHS, allowing them to bypass NHS waiting lists for eligible treatment at private facilities,  providing a safety valve the Sanders bill’s duplicate-coverage ban would eliminate.⁶

The Bottom Line

The Medicare for All Act is not a straightforward import of an existing European or Canadian model. It combines an unprecedented population scale, the near-total elimination of cost-sharing mechanisms that most peer systems still rely on, a broader core benefit package than any comparable country currently guarantees, and a ban on private competition stricter than what even single-payer Britain imposes. Whether that combination is a strength (a more genuinely universal system) or a liability (an untested set of simultaneous departures from every working model) is the crux of the policy debate — but it should be argued on those terms, rather than on the premise that the bill simply replicates what other countries already do successfully.


Sources

  1. Medicare for All Act, H.R. 3069, 119th Cong. (2025); S. 1506, 119th Cong. (2025). Full text: congress.gov/bill/119th-congress/house-bill/3069/text
  2. Office for National Statistics, UK population estimates; NHS England, “Overview of the NHS.” Commonwealth Fund International Health Care System Profiles — United Kingdom: commonwealthfund.org/international-health-policy-center/countries/united-kingdom
  3. Commonwealth Fund International Health Care System Profiles — Canada (2026 update): commonwealthfund.org/international-health-policy-center/countries/canada; PDF: commonwealthfund.org/sites/default/files/2026-04/2026_Country-Profiles_Canada.pdf
  4. Canadian Medical Association, “Who pays for Canadian health care?” cma.ca/healthcare-for-real/who-pays-canadian-health-care
  5. Commonwealth Fund International Health Care System Profiles — France, Germany, Netherlands: commonwealthfund.org/international-health-policy-center/system-profiles
  6. Commonwealth Fund International Health Care System Profiles — United Kingdom; general description of parallel NHS/private insurance structure consistent with the National Health Service Act 2006 framework.

Medicare for All: A Bold Promise or a House of Cards?

The American healthcare system is broken!  That’s something a majority of Americans can agree on.  How to fix it does not have such strong consensus.  When it comes to fixing American healthcare, few proposals have generated as much passion, or as much fierce debate, as Senator Bernie Sanders’ Medicare for All. 

On the surface, the promise is incredibly appealing: you walk into any hospital or doctor’s office, receive whatever care you need, and walk out without ever seeing a bill, a copay, or a deductible. No more fighting with insurance companies over claims. No more medical debt. Who wouldn’t want that? 

But you can’t just legislate this into existence without considering the costs and the consequences.  This is the first in a series of essays exploring those parts of the story. To understand if Medicare for All makes “good sense,” it is vital to look past the rhetoric and closely examine the math, the mechanics, and the monumental disruptions it would introduce to the American economy.

The first thing to understand is how Medicare for All is designed

The Sanders plan is a “single-payer” national health insurance program. This means the federal government completely replaces private commercial insurance and becomes the sole entity paying for medical care in the United States.  Often called a “single payer” system, it is designed to consolidate the entire healthcare delivery system into a single administrative structure.

The structure relies on four core pillars:

  • Universal Coverage: Every U.S. resident is automatically enrolled, with coverage beginning at birth or on establishing residency.
  • Zero Out-of-Pocket Costs: All premiums, deductibles, and copays are eliminated for covered services, with prescription drugs the sole exception. (prescription drugs would have a small annual out of pocket max satisfied through co-pays)
  • Comprehensive Benefits: The plan covers hospital care, mental health and substance abuse treatment, dental, vision, hearing, long-term care, and reproductive and gender-affirming care.
  • A Ban on Duplicate Private Insurance: Private insurers and employers may only sell coverage that supplements the government program, not coverage that duplicates it.  Note this one.  It means the health insurance companies are out of business.

The current version of Medicare for All legislation suggests this system could be fully introduced over two years. ¹ Starting one year after enactment, children 18 and under, adults 55 and older, and those already on Medicare become eligible; by year two, coverage extends to everyone else.  This sounds great, and many believe it is a substantial improvement over earlier versions that suggested it would take 4 years to implement.  However, this faster on-ramp makes the cost analyses even more problematic.

Does this plan make Good Sense?  Initial analysis reveals at least three critical concerns that could each be the “fatal flaw.”

1. The Trillion-Dollar Revenue Disparity

The most immediately glaring issue with Medicare for All is the math on the federal balance sheet. A 2019–2020 Urban Institute and Commonwealth Fund analysis put the federal cost of a comparable single-payer system at roughly $32 trillion over ten years; a separate 2018 study by Charles Blahous of the Mercatus Center put the figure at $32.6 trillion over the same period, using assumptions favorable to the plan’s proponents.² ³ Both studies modeled the bill’s earlier four-year phase-in.  No independent group has re-run these models against the 2025 bill’s compressed two-year timeline.  When those models are run it is likely that the overall costs will increase as larger numbers of American come on board earlier increasing utilization costs.

To pay for this, proponents, led by Senator Bernie Sanders, proposed a menu of progressive taxes, including a 4% individual income surcharge, a 7.5% employer payroll tax, and various wealth and corporate taxes. Independent analysts estimate that these combined taxes would likely fall well short of the $3.2–3.4 trillion in new annual spending, leaving a structural funding gap which could easily be in the hundreds of billions to over a trillion dollars per year, depending on which revenue and cost assumptions are used. Closing that gap would require either significantly higher taxes on all Americans, especially middle-class families, or a broad-based consumption tax.  The argument that the increased costs are offset by savings across the healthcare system are considered in point number 3 below. Note, however, that the projected savings across the system do not equal the estimate 1 plus trillion-dollar annual budget deficits.

2. The Patient Influx vs. Shrinking Provider Pool

If you make a vital service completely free at the point of delivery, demand for that service will inevitably rise. Under the compressed two-year design, most of that demand surge, everyone not already covered in year one, arrives in a single additional year rather than spread across three.  There are clear reasons to doubt that the system will have the capacity to meet that surge.

The supply of doctors, nurses, and hospital beds cannot scale overnight under any timeline. Because the plan aims to control costs by capping reimbursement rates near traditional Medicare levels, rates the Medicare Payment Advisory Commission (MedPAC) and multiple hospital associations have long noted run below private insurance rates, many hospitals could face revenue shortfalls that prompt closures or early physician retirements, shrinking the provider pool just as the compressed timeline asks it to absorb more patients, faster.

When a faster patient influx meets a static or shrinking pool of providers, the result is unavoidable: care rationing shifts from financial to temporal. Patients won’t be priced out of care, they’ll be timed out of it, facing longer waits for elective surgeries, specialist visits, and diagnostic imaging.  The outcry today is that people are not getting necessary care because they can’t afford it.  The likely outcome of the Medicare for All plan is that people will not get necessary care because they can’t get an appointment with a doctor, or they can’t get the test they need, or they can’t get a surgery scheduled.

The plan’s financial viability makes a huge and unsubstantiated assumption.  It assumes up front that administrative costs will fall from the 12–15% typical of private insurers to the roughly 2% reported for traditional Medicare.  The argument offers up substantial savings numbers for the system as a whole. For example, a December 2020 Congressional Budget Office working paper modeled several illustrative single-payer designs and found administrative savings ranging from $42 billion to $743 billion annually depending on assumptions.  The most often cited savings number is $650 billion, but this comes from CBO’s most favorable “low payment rate, low cost-sharing” scenario, not a formal score of this bill.⁴ That analysis, like the Urban and Mercatus estimates, predates the 2025 bill’s faster rollout.  In other words, these are highly optimistic numbers that are not supported by solid financial models.  More detail on this problem will come in a later essay.

3. The Myth of Effortless Administrative Gains

Sources

Not only is the administrative gain open to dispute, dismantling the private insurance sector would displace a substantial share of the health insurance workforce. A 2018 economic analysis by researchers at the University of Massachusetts Amherst’s Political Economy Research Institute (PERI), a study broadly sympathetic to Medicare for All, estimated the number of displaced workers in insurance and related administrative roles at approximately 1.8 million, including nearly 300,000 workers aged 60 or older.⁵ What happens to those workers and those jobs?

While the plan proposes a federally funded Worker Transition Trust Fund to provide retraining and temporary wage replacement, history shows that government-run retraining programs struggle to efficiently transition displaced workers into comparable, high-paying careers.  This is such an important part of this analysis it will get major focus in one of the later essays in this series.

The Bottom Line

Medicare for All sounds good.  It plan attempts to pull off an unprecedented economic feat: covering 340 million people with the most generous benefits package in the developed world, outlawing market competition, and eliminating out-of-pocket costs — all while assuming administrative costs fall dramatically. The 2025 version raises the stakes further by compressing the rollout from four years to two, asking the tax base, the provider system, and the administrative machinery to adjust faster than any existing cost model has actually tested.

Good sense dictates that before we tear down the foundation of American healthcare on a tighter schedule than originally proposed, we should make sure the replacement blueprint isn’t a house of cards.


  1. Reintroduced in April 2025 alongside Reps. Pramila Jayapal and Debbie Dingell as S.1506 in the Senate and H.R.3069 in the House.  Medicare for All Act, H.R. 3069, 119th Cong. (2025); S. 1506, 119th Cong. (2025). Full text: congress.gov/bill/119th-congress/house-bill/3069/text
  1. Urban Institute & Commonwealth Fund (2019). From Incremental to Comprehensive Health Insurance Reform. urban.org/research/publication/estimating-cost-single-payer-plan
  2. Blahous, C. (2018). The Costs of a National Single-Payer Healthcare System. Mercatus Center at George Mason University. mercatus.org — “How the Urban Institute’s Estimates of Medicare for All Costs Stack Up”
  3. Congressional Budget Office (December 2020). How CBO Analyzes the Costs of Proposals for Single-Payer Health Care Systems. cbo.gov/publication/56898
  4. Pollin, R., Heintz, J., Arno, P., Wicks-Lim, J., & Ash, M. (2018). Economic Analysis of Medicare for All. Political Economy Research Institute, University of Massachusetts Amherst, Appendix 6. peri.umass.edu/publication/economic-analysis-of-medicare-for-all
  5. Jayapal, P., quoted in “‘Medicare-for-all’ sponsor says plan would gut 1 million private insurance jobs,” Fox News (2019). foxnews.com/politics/medicare-for-all-would-gut-a-million-private-insurance-jobs

Medicare for All: The Hidden Truths Uncovered

I see more and more posts with people advocating Medicare for All or some other form of single payer healthcare system in the United States. It’s a grand idea, but it just won’t work. Let me explain why.
Let’s start with some core assumptions behind this debate.

  1. A single-payer system would make healthcare services available to all Americans on an equal basis with no “out of pocket” cost for services provided.
  2. A single-payer system would remove the need for private/commercial insurance coverage and the associated premiums and out of pocket costs.
  3. All medical services can and would be available through the single-payer system.
  4. Costs for a single-payer system could be covered by reducing current spending on other programs (i.e. defense) and/or by increasing taxes paid by high income/high net worth individuals.
  5. Systems similar to those in other developed countries could be used as a model for an effective system in the United States.
    Let’s consider the idea of Medicare for all. In this model, Medicare would be expanded to include every American. When people suggest this, I think most don’t understand how Medicare actually works.
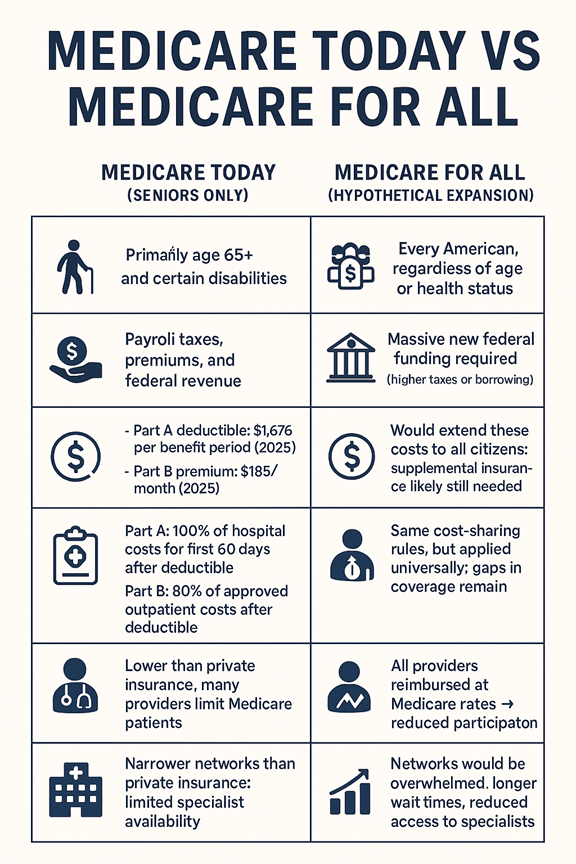
    What is Medicare?: Medicare is the federal health insurance program primarily for people aged 65 and older, though it also covers younger individuals with certain disabilities or conditions like End-Stage Renal Disease. Medicare is divided into four parts:
    • Part A (Hospital Insurance): Covers inpatient hospital stays, skilled nursing facilities, hospice, and some home health care.
    • Part B (Medical Insurance): Covers outpatient care, doctors’ services, preventive services, and medical supplies.
    • Part C (Medicare Advantage): Private plans approved by Medicare that bundle Parts A and B, often with additional benefits (i.e. Dental, Vision, Fitness).
    • Part D (Prescription Drug Coverage): Helps cover the cost of medications.
    Because original medicare does not cover all costs and does not include prescription drug coverage, the system has approved additional coverage options to help.
    • Medicare Supplements (sometimes called Medigap) offer supplemental coverage that helps cover the cost of out of pocket expenses not covered my Part A and Part B.
    So, Medicare operates as a partnership between the government and private insurance companies. But let’s keep looking to see what else we need to know.

Medicare is not free; Medicare is often misunderstood as “free healthcare,” but in reality, it is a cost-sharing system between the government and beneficiaries. enrollees pay premiums, deductibles, and coinsurance, and the program itself is funded by payroll taxes, premiums, and general federal revenue. To understand why expanding it to all Americans would be so expensive, it’s important to look at how much Medicare actually pays versus what patients still owe.
The Cost of Medicare for Current Seniors
Medicare already represents a significant financial burden:
Medicare Part A (Hospital Insurance)
• Coverage: Inpatient hospital stays, skilled nursing facilities, hospice, and some home health care.
• Costs Covered:
o After you pay the deductible ($1,676 in 2025), Medicare Part A covers 100% of hospital costs for days 1–60 of a benefit period.
o For days 61–90, patients pay a daily coinsurance ($419 in 2025).
o Beyond 90 days, patients can use lifetime reserve days (up to 60 total), but coinsurance rises to $838 per day.
• Bottom Line: Medicare Part A covers the bulk of short-term hospital stays, but extended stays quickly shift costs back to patients.
Medicare Part B (Medical Insurance)
• Part B: The standard monthly premium in 2025 is $185 (going up to $205 in 2026), with a deductible of $257 ($283 for 2026). Higher-income seniors pay more (sometimes a lot more. Do a quick Google search for IIRMA and check it out).
• Coverage: Outpatient care, doctor visits, preventive services, lab tests, imaging, durable medical equipment, and mental health services.
• Costs Covered:
o After the annual deductible, Medicare Part B pays 80% of approved medical costs.
o Patients are responsible for the remaining 20% coinsurance, and some providers may charge up to 15% more (known as “excess charges”) if they accept Medicare but not full assignment.
• Bottom Line: Medicare Part B is a cost-sharing plan, not full coverage. Patients must budget for 20% of nearly all outpatient services.
• Oh, and Medicare Part B does not cover an annual physical with no cost sharing like ACA or employer sponsored plans do.
Medicare Part D
• Part D: Prescription drug coverage also comes with premiums and income-related surcharges. Deductibles can vary by plan but could be as high as $615.00 in 2026 while premiums are projected to average $35.00 with some people paying significantly more. And then, members must still pay the co-pays for their specific medications up to the annual out of pocket limit of $2,100.
These costs are substantial even for the current senior population. Expanding Medicare to cover all Americans would multiply these expenses dramatically, requiring either massive tax increases or unsustainable federal borrowing. In fact, it is quite possible that implanting this system would actually force most American households to pay more out of pocket (in the form of taxes) than they currently pay through premiums and out-of-pocket costs under their private insurance plans.
So, ok it would be expensive. And maybe we could find away to reduce costs or increase taxes enough to pay for it, but what happens when we add everyone in the country to this single system? How does the system absorb all of those new members?


The Strain on Provider Networks
Medicare’s provider networks are already limited compared to private insurance. Studies show that Medicare Advantage enrollees often have access to only about half of the physicians in their area compared to traditional Medicare. Narrow networks and reimbursement challenges mean that many providers are reluctant to accept Medicare patients.
If Medicare for All were implemented many researchers predict:
• Provider shortages would worsen. Doctors and hospitals already face reimbursement rates lower than private insurance, which could discourage participation.
• Rural hospitals in the US are already under financial strain. Forcing them to accept all patients with current Medicare reimbursement rates could force many of them into bankruptcy. At the very least it would force providers to ration their time and create long waiting lists for non-urgent services.
• Wait times would increase. With tens of millions of new patients entering the system, the demand for services would far outpace supply.
• Quality of care could decline. Overburdened networks would struggle to maintain standards, especially for complex or specialized care.


Conclusion
Medicare for All may sound appealing as a universal solution, but the reality is stark:
• Medicare is already expensive for seniors and taxpayers.
• Expanding it nationwide would require enormous new funding.
• Provider networks would be overwhelmed, leading to longer waits and reduced access.
• We haven’t even considered the disruption that would be caused by the loss of 600,000 to 900,000 jobs in the private health insurance industry. None of the models account for that disruption.
For these reasons and more, I believe Medicare for All is not a practical or sustainable path for the U.S. healthcare system. Instead, reforms should focus on improving affordability and access without dismantling the balance between public and private coverage.