Part 3 in the Medicare for All House of Cards Series
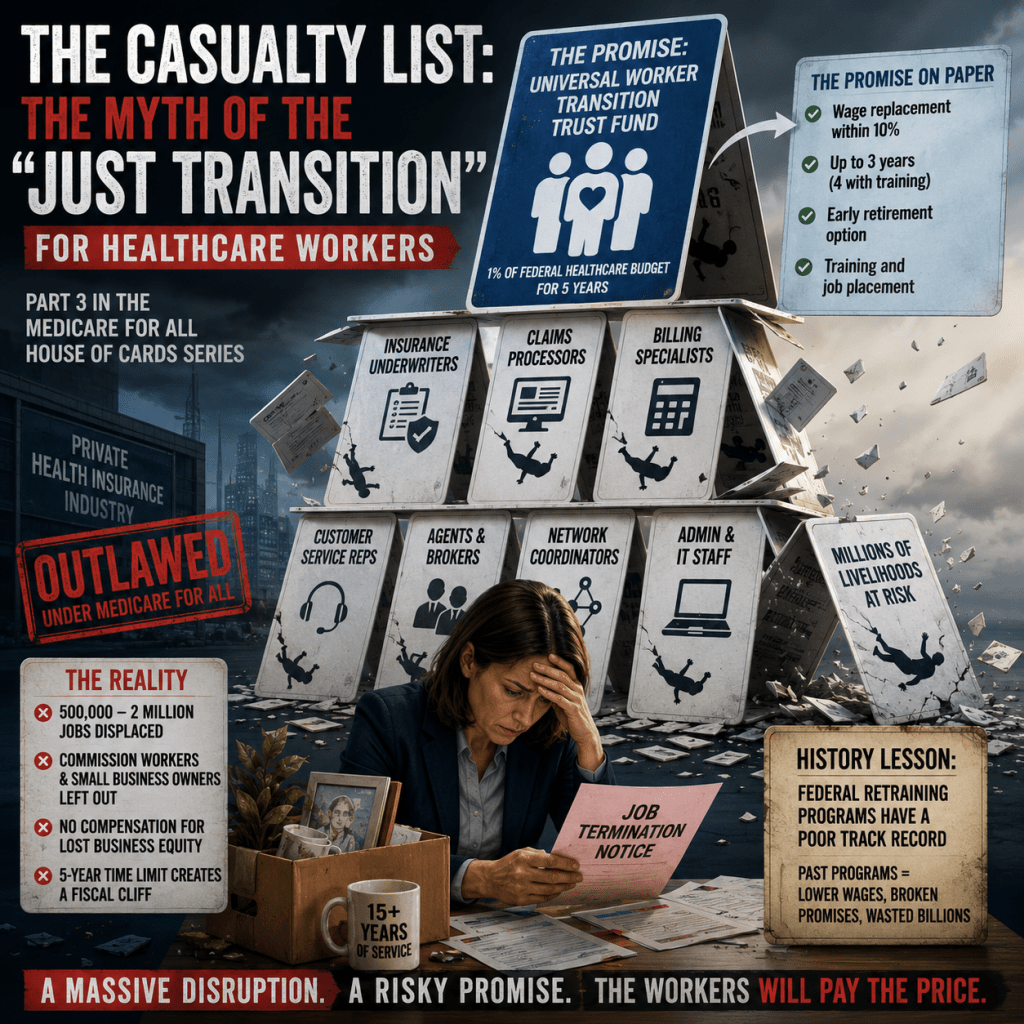
Medicare for All sounds like a great solution to the problems in the US healthcare system, but when people talk about it they often do so without any recognition of the human cost of making this kind of structural change. Implementing this plan would completely eliminate the health insurance industry and severely decrease opportunities for hundreds of thousands of Americans in businesses tied to that industry. This cost must be added to the assessment of the overall plan.
The policy makers putting forth the Medicare for All plan are fully aware of the potential impact on the workforce. When policymakers discuss these types of massive structural shifts, they frequently lean on a comforting euphemism: the “just transition.” In the Medicare for All Act of 2025 (S.1506/H.R.3069)¹, this concept takes the form of a federally funded worker transition program. Recognizing that a single-payer system would eliminate the private commercial health insurance market, the bill’s supporters promise to protect the livelihood of every displaced worker.
It is a noble promise, but it runs up against a significant logistical reality. A 2018 economic analysis by researchers at the Political Economy Research Institute (PERI) at UMass Amherst, a study conducted in support of Medicare for All, not against it, estimated that eliminating the private insurance and medical billing bureaucracy would displace approximately 1.8 million workers, including nearly 300,000 aged 60 or older.² A critical look at the funding mechanism and America’s historical record with federal job-retraining reveals real reasons for caution.
The Legislative Blueprint
The bill text provides for wage replacement, continued retirement and pension benefits, job training and placement, preferential hiring for displaced workers into new government roles, and education benefits.¹ Beyond that general framework, the precise formulas, how long wage support lasts, how it’s calculated for workers with variable income, and how tightly the transition period is bounded, are not fully specified in the bill text as introduced, leaving important implementation details to be worked out administratively.
This creates real ambiguity for certain groups. Independent insurance agents and brokers whose income relies on fluctuating commissions and policy renewals present a genuine complication: calculating a fair wage-replacement baseline for a self-employed contractor is more complex than for a salaried employee, and the bill does not appear to address the loss of a broker’s “book of business,” an active client portfolio that functions as a sellable asset, as a compensable loss.
The Structural Vulnerability of the Funding Model
Rep. Jayapal has publicly confirmed the funding mechanism: 1% of the total cost of the bill, set aside annually for five years, to support displaced workers.³ If, as estimates suggest, the single-payer budget runs $3–3.4 trillion annually, that translates to roughly $30–34 billion a year for worker transition. This money comes out of the same overall health care budget, rather than from a separate, dedicated fund. That creates a structural tension: every dollar spent on severance, retraining, and placement services for displaced workers is a dollar not spent on direct patient care. And because the fund is bounded at five years, the program faces a hard cutoff if structural unemployment in this sector proves more persistent than anticipated.
The Historical Record: Why Federal Retraining Often Falls Short
Proponents argue that unprecedented funding levels will succeed where past programs failed. But America’s track record with federal job retraining gives real reason for skepticism. The clearest example is Trade Adjustment Assistance (TAA), the flagship federal program for retraining manufacturing workers displaced by trade. A rigorous 2012 evaluation conducted by Mathematica Policy Research for the U.S. Department of Labor, using a matched comparison group of similar displaced workers who did not participate in TAA, found that TAA participants earned about $3,300 less annually than their non-participating counterparts in the final year of the multi-year follow-up period, and calculated the program’s overall net benefit to society as negative.⁴ The researchers noted this may partly reflect the time it takes older, long-tenured workers to successfully retrain, a dynamic that could plausibly recur among displaced insurance-industry workers, many of whom are older, specialized administrative staff. Coal-to-clean-energy retraining programs offer a second cautionary parallel: these initiatives have consistently struggled with geographic and skill mismatches between displaced workers and available new jobs.
The Bottom Line
The Worker Transition program relies on succeeding where comparable federal efforts have historically struggled. Generous funding can pay for training and temporary income support, but it cannot guarantee that hundreds of thousands of specialized insurance and billing workers will find comparable new roles on the timeline the bill anticipates. The gap between the money committed and the outcomes historically achieved by similar programs is worth taking seriously before assuming this transition will go smoothly.
Let’s be clear, the problem with the Sanders plan isn’t a lack of funding for workers; it is a fundamental misunderstanding of labor logistics. Throwing $150 billion at a problem can buy tuition and extend unemployment checks, but it cannot instantly manufacture hundreds of thousands of vacant, high-paying, white-collar jobs that perfectly match the skills of displaced corporate insurance workers. Shifting an entire workforce by government decree is an incredibly slow, friction-heavy process. By limiting the trust fund to a strict five-year window, the plan assumes an economic agility that the federal government has never historically been able to deliver.
Sources
- Medicare for All Act, H.R. 3069, 119th Cong. (2025); S. 1506, 119th Cong. (2025). Full text: congress.gov/bill/119th-congress/house-bill/3069/text
- Pollin, R., Heintz, J., Arno, P., Wicks-Lim, J., & Ash, M. (2018). Economic Analysis of Medicare for All. Political Economy Research Institute, University of Massachusetts Amherst, Appendix 6: “Estimating Displaced Workers.” peri.umass.edu/publication/economic-analysis-of-medicare-for-all
- Jayapal, P., quoted in “‘Medicare-for-all’ sponsor says plan would gut 1 million private insurance jobs,” Fox News (2019). foxnews.com/politics/medicare-for-all-would-gut-a-million-private-insurance-jobs
- Schochet, P.Z., D’Amico, R., Berk, J., Dolfin, S., & Wozny, N. (2012). Estimated Impacts for Participants in the Trade Adjustment Assistance (TAA) Program Under the 2002 Amendments. Mathematica Policy Research, prepared for the U.S. Department of Labor. dol.gov/sites/dolgov/files/ETA/publications/ETAOP_2013_08.pdf
For Further Reading: Sources for the “House of Cards” Medicare for All Series
This document consolidates every source used to verify claims across all three essays in the Medicare for All series, plus additional context readers may find useful. Organized by topic.
The Bill Itself
- Medicare for All Act, H.R. 3069, 119th Congress (2025) — introduced April 29, 2025 by Rep. Pramila Jayapal, with Rep. Debbie Dingell and Sen. Bernie Sanders. Full text: congress.gov/bill/119th-congress/house-bill/3069/text | Bill text (GovInfo): govinfo.gov/content/pkg/BILLS-119hr3069ih
- Medicare for All Act, S. 1506, 119th Congress (2025) — Senate companion bill introduced by Sen. Bernie Sanders. Full text and CRS summary: congress.gov/bill/119th-congress/senate-bill/1506
- Physicians for a National Health Program (PNHP), “The Medicare for All Act of 2025” — advocacy overview and links to bill summaries: pnhp.org/the-medicare-for-all-act-of-2025
Federal Cost Estimates
- Blahous, C. (2018). The Costs of a National Single-Payer Healthcare System. Mercatus Center at George Mason University. Estimated ~$32.6 trillion in added federal costs over 10 years (2022–31), using assumptions favorable to the plan’s proponents as a lower-bound estimate. mercatus.org — “How the Urban Institute’s Estimates of Medicare for All Costs Stack Up”
- Urban Institute & Commonwealth Fund (2019). From Incremental to Comprehensive Health Insurance Reform. Estimated ~$32–34 trillion in added federal costs over 10 years (2020–29). urban.org/research/publication/estimating-cost-single-payer-plan
- Congressional Budget Office (December 2020). How CBO Analyzes the Costs of Proposals for Single-Payer Health Care Systems. Modeled four illustrative single-payer designs; savings ranged from $42 billion to $743 billion in 2030 depending on assumptions, with the closest match to current bills (“Option 3”) yielding roughly $650 billion in savings — the source of the frequently cited “$650 billion” figure. Note: this is an analysis of illustrative design options, not a formal score of H.R. 3069/S. 1506. cbo.gov/publication/56898
- Pollin, R., Heintz, J., Arno, P., Wicks-Lim, J., & Ash, M. (2018). Economic Analysis of Medicare for All. Political Economy Research Institute (PERI), UMass Amherst. A study conducted in support of the 2017 Sanders bill; estimated net national health spending would fall by about 9.6% under the plan. peri.umass.edu/publication/economic-analysis-of-medicare-for-all
- Yale School of Public Health study (Galvani et al., 2020), published in The Lancet — estimated Medicare for All could save approximately 68,000 lives and reduce health spending by roughly 13% (~$450 billion) annually. Referenced in: Public Citizen, “Fact Check: Medicare for All Would Save the U.S. Trillions”
Worker Displacement and Transition
- PERI (2018), Appendix 6: “Estimating Displaced Workers” — estimated approximately 1.8 million workers displaced from private health insurance and related administrative roles, including nearly 300,000 aged 60 or older. Same source as above.
- Jayapal, P. — public statement confirming the “1% of total bill cost, set aside annually for five years” worker transition funding mechanism, and a separate public estimate of “about a million” displaced workers. Reported in: Fox News, “‘Medicare-for-all’ sponsor says plan would gut 1 million private insurance jobs” (2019)
- Schochet, P.Z., D’Amico, R., Berk, J., Dolfin, S., & Wozny, N. (2012). Estimated Impacts for Participants in the Trade Adjustment Assistance (TAA) Program Under the 2002 Amendments. Mathematica Policy Research, prepared for the U.S. Department of Labor. Found TAA participants earned about $3,300 less annually than a matched comparison group in the final follow-up year; overall net benefit to society calculated as negative. dol.gov/sites/dolgov/files/ETA/publications/ETAOP_2013_08.pdf
- U.S. Department of Labor, “National Evaluation of the Trade Adjustment Assistance Program” — background on TAA program design and participation rates. dol.gov/agencies/eta/research/publications/national-evaluation-trade-adjustment-assistance-program
International Comparisons
- Commonwealth Fund, International Health Care System Profiles — the standard reference for cross-national health system comparisons; individual country profiles used for Canada, the United Kingdom, France, Germany, and the Netherlands. Main hub: commonwealthfund.org/international-health-policy-center/system-profiles
- Canada profile: commonwealthfund.org/international-health-policy-center/countries/canada
- United Kingdom profile: commonwealthfund.org/international-health-policy-center/countries/united-kingdom
- Canadian Medical Association, “Who pays for Canadian health care?” — plain-language explanation of what Canada’s public system does and doesn’t cover. cma.ca/healthcare-for-real/who-pays-canadian-health-care
- Canada Health Act — the federal framework governing provincial single-payer administration in Canada.
Independent Fact-Checking and Context
- KFF Health News, “Would ‘Medicare For All’ Cost More Than U.S. Budget? Biden Says So. Math Says No.” — useful context on comparing 10-year cost estimates to annual federal budgets. kffhealthnews.org
- Committee for a Responsible Federal Budget, “Fact Checking Medicare for All Claims” — independent breakdown of competing cost estimates. crfb.org/blogs/fact-checking-medicare-all-claims-fourth-democratic-primary-debate
- National Taxpayers Union Foundation, “Medicare for All: Buyer Beware” — critical-perspective summary of multiple independent cost analyses (Urban, Mercatus, CRFB, Thorpe, Center for Health and Economy). ntu.org/foundation/detail/medicare-for-all-buyer-beware
 Good Sense - A Discussion of Culture and Issues in America Today